
Translate this page into:
Comparison of measurements obtained by an optical low coherence interferometry biometer and a swept source optical coherence tomography biometer in two datasets
*Corresponding author: Christopher Ashton, Department of Ophthalmology, Imperial College Healthcare NHS Trust, London, United Kingdom. christopherashton@nhs.net
-
Received: ,
Accepted: ,
How to cite this article: Ashton C, Rahimzadeh M, Gupta A, Corbett M, Saw V. Comparison of measurements obtained by an optical low coherence interferometry biometer and a swept source optical coherence tomography biometer in two datasets. Glob J Cataract Surg Res Ophthalmol. 2025;4:24-31. doi: 10.25259/GJCSRO_37_2024
Abstract
Objectives
The objective of this study was to compare the similarity of biometry measurements between the Lenstar® (Haag-Streit AG, Switzerland), which uses optical low coherence reflectometry, and Anterion® (Heidelberg Engineering, Heidelberg, Germany), which uses swept-source optical coherence tomography technology, in two datasets.
Materials and Methods
This retrospective study was conducted at a single tertiary referral centre. Biometry measurements from Lenstar and Anterion were collected in two datasets. Dataset 1 was collected between November 2021 and June 2022, with scans taken on the same eye on different days by different technicians. Dataset 2 was collected between September 2022 and November 2022, with scans taken on the same day by the same operator.
Results
A total of 196 eyes from 130 patients across two datasets were included in the study. Axial length (AL), flat keratometry (K1), steep keratometry (K2) and anterior chamber depth (ACD) showed excellent similarity, but white-to-white (WTW) reproducibility was poor to moderate in both samples. There was no statistical difference in AL and K1 between the biometers in both datasets. Statistical differences between the biometers were found for lens thickness (LT) and WTW in both datasets and ACD in one dataset.
Conclusion
The devices showed similar measurements and consistency for AL. Scanning patients on different days with different technicians yielded similar results to scanning patients on the same day by a single technician. These findings have implications for short eyes and fourth-generation formulae, where the inclusion of ACD, LT and WTW in the lens calculation formula can result in differences in calculated intraocular lens power.
Keywords
Axial length
Biometry
Intraocular lens calculation
Intraocular lens formula
Keratometry

INTRODUCTION
Accurate biometry measurements are essential for optimal intraocular lens (IOL) power calculation in cataract surgery.[1] Contemporary optical biometers assess key ocular parameters, including axial length (AL), flat keratometry (K1) and steep keratometry (K2), anterior chamber depth (ACD), lens thickness (LT) and white-to-white (WTW) distance. The IOLMaster® (Carl Zeiss Meditec, Jena, Germany), introduced in 1999, pioneered the use of partial coherence interferometry for non-contact biometry.[2,3] Despite its efficiency, this device necessitated visual axis realignment between parameter measurements due to disparate measurement principles.
Technological advancements have yielded new biometers utilising novel methodologies. This study aims to compare biometric measurements obtained from two such instruments: The Lenstar® (Haag-Streit AG, Switzerland), which employs optical low-coherence reflectometry (OLCR), and the Anterion® (Heidelberg Engineering, Heidelberg, Germany), which utilises swept-source optical coherence tomography (SS-OCT). The comparison will be conducted within a National Health Service (NHS) cataract clinic setting, analysing two distinct datasets:
Scans acquired on different days by multiple technicians, simulating real-world clinical variability
Same-day scans performed by a single technician, minimising operator-dependent variables.
Through analysis of these datasets, we seek to evaluate the agreement between these advanced biometers and assess their potential impact on clinical practice. This study’s findings may inform the selection and utilisation of biometric devices in cataract surgery planning, potentially influencing surgical outcomes and patient care.
MATERIALS AND METHODS
This study adhered to the tenets of the Declaration of Helsinki. Informed consent was obtained from all patients. The study was registered as an audit (number OPH_099).
Study design
This was a retrospective observational study comparing biometry measurements taken by Anterion and Lenstar biometers using two distinct datasets.
Lenstar biometer
The Lenstar LS 900® (Haag-Streit AG, Switzerland) employs OLCR technology, utilising an 820 nm laser diode infrared light source for AL measurements.[4] This device also provides measurements of central corneal thickness, LT, retinal thickness and ACD. Keratometry readings are obtained through analysis of the anterior corneal curvature at 32 reference points distributed across two circular optical zones with diameters of 1.65 mm and 2.35 mm.[5] In addition, the instrument assesses pupil size and centricity.
Anterion biometer
The Anterion® (Heidelberg Engineering, Heidelberg, Germany) is an advanced optical biometer utilising high-resolution swept-source technology. It operates at a wavelength of 1300 nm, with a scan rate of 50,000 Hz and an axial resolution of <10 microns.[6,7] This wavelength range offers superior tissue penetration compared to its predecessors that employ partial coherence interferometry, enabling more accurate measurements in patients with posterior subcapsular and dense cataracts.[8] Corneal measurements are obtained using a radial pattern of 65 b-scans, each 9.0 mm in length.[6]
The device incorporates four integrated applications: Cornea App, Cataract App, Metrics App and Imaging App. In a single scan, these applications collectively provide comprehensive ocular assessment, including anterior segment imaging, corneal tomography and topography, anterior segment biometry, IOL power calculation and AL measurement.
Dataset 1
The first dataset comprised patients presenting to the cataract clinic between November 2021 and June 2022 at Imperial College Hospital. Measurements were taken by both biometers on patients with inter-eye AL differences and dense cataracts, to counter-check pre-assessment clinic measurements. Measurements were taken on different days by different technicians.
Dataset 2
The second dataset included patients presenting to the cataract clinic between September 2022 and November 2022 at Imperial College Hospital. Measurements were taken by both biometers on patients with inter-eye AL differences and dense cataracts, to counter-check pre-assessment clinic measurements. In contrast to dataset 1, all measurements in dataset 2 were taken on the same eye, on the same day, by the same technician.
Inclusion/exclusion criteria
Measurements of AL, K1 and K2 in dioptres, ACD, LT and WTW were included in the study. Inclusion criteria encompassed any patient with biometry readings from both Anterion and Lenstar awaiting cataract surgery. Exclusion criteria included patients with previous corneal surgery, keratoconus, refractive laser treatment and pterygium. Short and long ALs were included in the study. All grades of cataracts were included in the study. Measurements were taken within 1 month of each other. Only scans of good quality were included in the analysis.
Statistical analysis
All data were anonymised and analysed with Microsoft Excel (v. 16.65, Microsoft Corp.). Statistical analysis was performed using IBM Statistical Package for the Social Sciences for Macintosh (v. 28.0.1.1). Data were described as mean ± standard deviation (SD) and 95% confidence intervals. Paired t-test was used to determine the difference between the measurements. Pearson’s correlation test calculated the correlation between instruments. Intraclass correlation coefficient (ICC) with 95% confidence intervals was used to compare intradevice consistency. Bland–Altman plots were used to assess the agreement between measurements. It plots the difference between measurements (Y-axis) against their mean (X-axis). The 95% limits of agreement (LoA = mean difference ± 1.96 SD of the difference) were used to compare the two methods.[9] P < 0.05 was defined as statistically significant.
RESULTS
Demographics
Dataset 1
A total of 153 eyes from 106 patients (60 female and 46 male) with a mean age of 69.8 ± 12.9 years (range: 25–95 years) were included in the study. Thirty-five eyes were excluded due to insufficient data, data gaps or poor-quality scans.
Dataset 2
A total of 42 eyes from 24 patients (14 female and 10 male) with a mean age of 74.0 ± 10.0 years (range: 50–87 years) were included in the study.
Descriptive analysis
Table 1 summarises the descriptive analysis of the Lenstar and Anterion values along with ICC values, P-values and Pearson correlations.
| Lenstar1 | Anterion1 | P2 | r3 | ICC (95% CI) | Mean difference (Lenstar-Anterion) | |
|---|---|---|---|---|---|---|
| Dataset 1 | ||||||
| AL (mm) | 23.78±1.37 | 23.78±1.39 | 0.66 | 0.99 | 0.998 (0.997–0.998) | 0.005±0.128 |
| K1 (D) | 43.22±1.47 | 43.18±1.45 | 0.18 | 0.94 | 0.971 (0.960–0.979) | 0.054±0.490 |
| K2 (D) | 44.25±1.60 | 44.14±1.39 | <0.01 | 0.96 | 0.981 (0.973–0.987) | 0.101±0.418 |
| ACD (mm) | 3.17±0.44 | 3.21±0.43 | <0.01 | 0.96 | 0.974 (0.961–0.983) | −0.044±0.132 |
| LT (mm) | 4.45±0.46 | 4.60±0.46 | <0.01 | 0.92 | 0.933 (0.712–0.972) | −0.153±0.181 |
| WTW (mm) | 11.87±0.77 | 11.75±0.48 | 0.02 | 0.54 | 0.650 (0.518–0.745 | 0.121±0.646 |
| Dataset 2 | ||||||
| AL (mm) | 23.27±±1.44 | 23.26±1.45 | 0.35 | 0.99 | 0.999 (0.999–1.000) | 0.010±0.067 |
| K1 (D) | 43.14±2.02 | 43.10±2.16 | 0.56 | 0.98 | 0.988 (0.978–0.994) | 0.041±0.454 |
| K2 (D) | 44.47±1.76 | 44.37±1.84 | 0.11 | 0.98 | 0.987 (0.976–0.993) | 0.100±0.393 |
| ACD (mm) | 3.09±0.38 | 3.07±0.36 | 0.51 | 0.82 | 0.901 (0.816–0.947) | 0.023±0.225 |
| LT (mm) | 4.35±0.78 | 4.80±0.59 | <0.01 | 0.59 | 0.639 (0.185–0.826) | −0.452±0.643 |
| WTW (mm) | 11.89±0.68 | 11.71±0.63 | <0.01 | 0.82 | 0.882 (0.753–0.940) | 0.180±0.340 |
1Mean±standard deviation, 2Paired t-test, 3Pearson’s correlation coefficient. AL: Axial length, ACD: Anterior chamber depth, WTW: White-to-white, LT: Lens thickness, ICC: Intraclass correlation coefficient, CI: Confidence interval
Dataset 1 demonstrated excellent reproducibility between instruments for AL, K1, K2, ACD and LT (ICC > 0.9). However, WTW showed poor reproducibility (ICC = 0.65). Dataset 2 showed excellent reproducibility for AL, K1 and K2 (ICC > 0.9), good reliability for ACD and WTW, but poor reliability for LT. The main difference between datasets was that dataset 1 showed poor reliability for LT, whereas dataset 2 showed poor reliability for WTW measurements. Bland–Altman plots for agreement analysis are presented in Figures 1-12. The thick black line represents the mean difference between devices, and the dotted lines represent the upper and lower LoA.
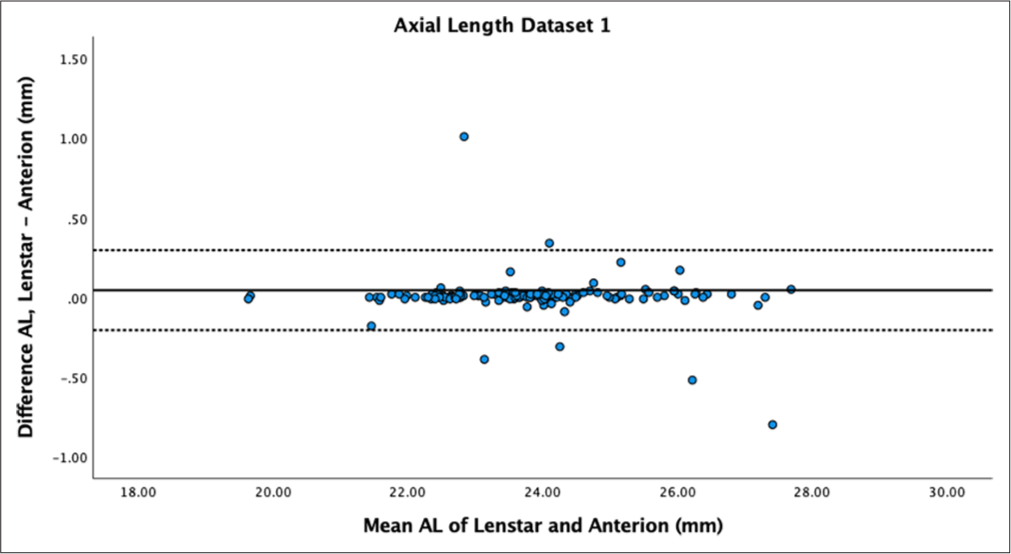
- Bland–Altman plot of axial length dataset 1. The mean difference is represented by the solid line and the 95% limits of agreement by the dotted line. AL: Axial length.
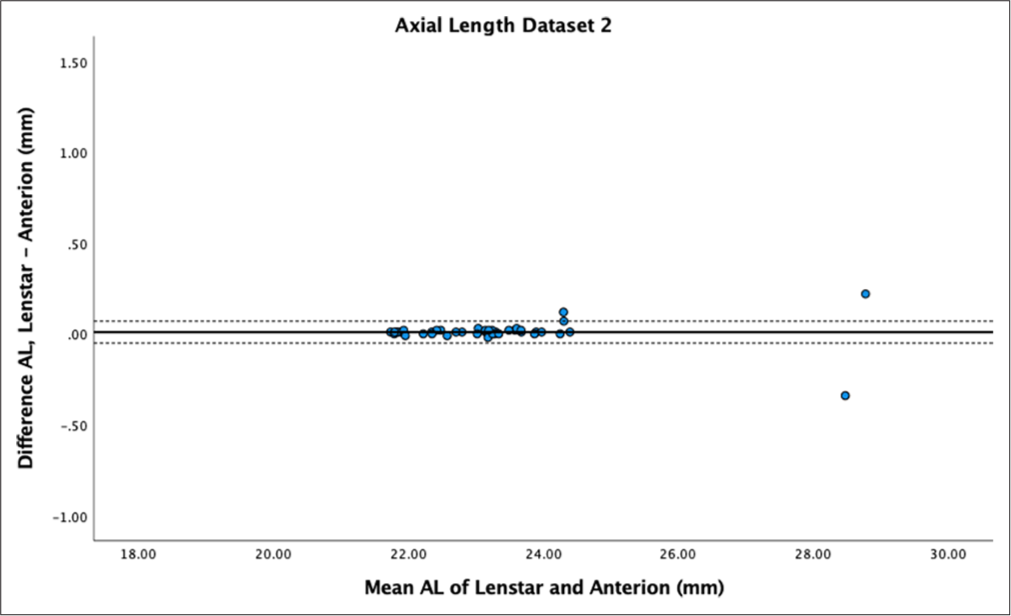
- Bland–Altman Plot of axial length dataset 2. The mean difference is represented by the solid line and the 95% limits of agreement by the dotted line. AL: Axial length.
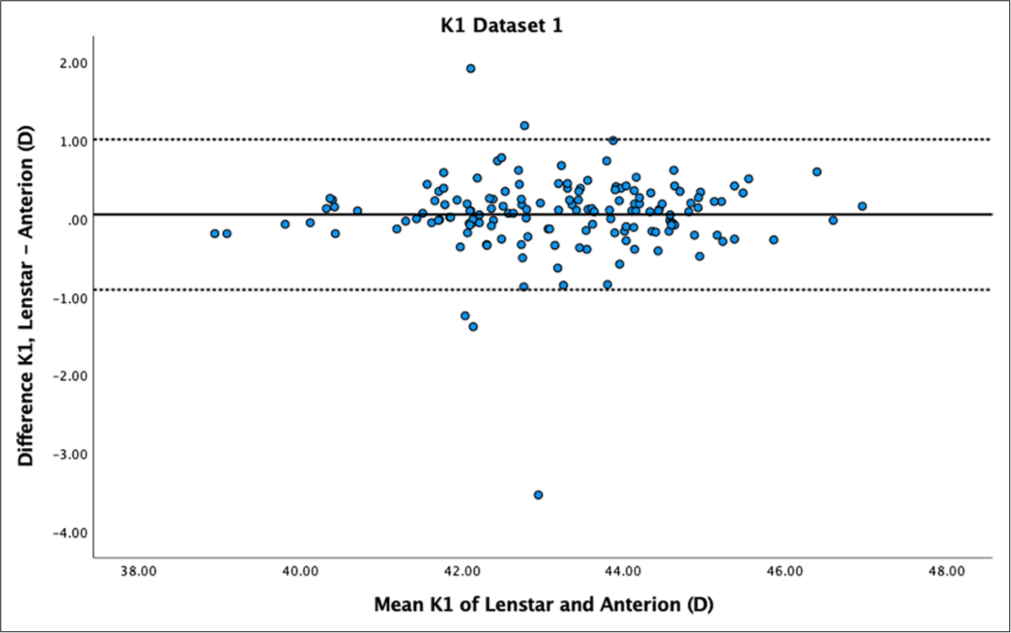
- Bland–Altman plot of K1 dataset 1. The mean difference is represented by the solid line and the 95% limits of agreement by the dotted lines.
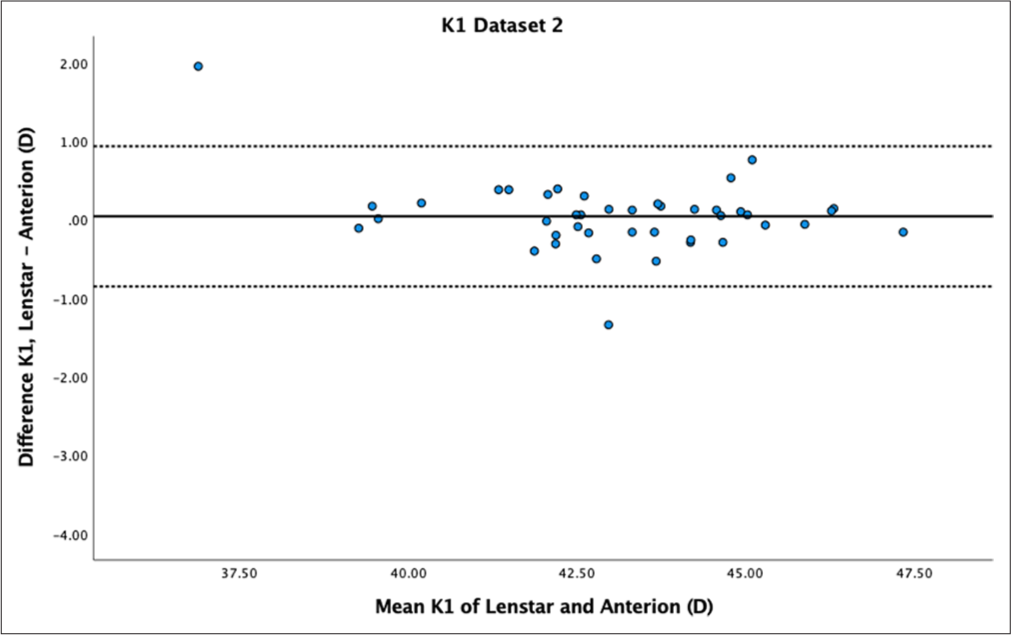
- Bland–Altman plot of K1 dataset 2. The mean difference is represented by the solid line and the 95% limits of agreement by the dotted lines.
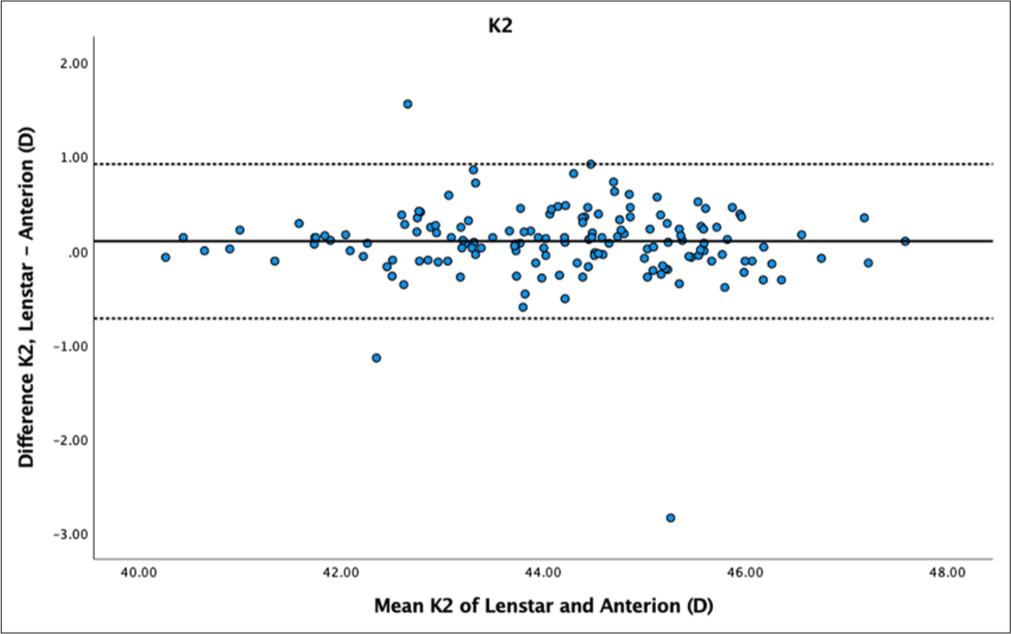
- Bland–Altman plot K2 dataset 1. The mean difference is represented by the solid line and the 95% limits of agreement by the dotted lines.

- Bland–Altman plot of K2 dataset 2. The mean difference is represented by the solid line and the 95% limits of agreement by the dotted lines.
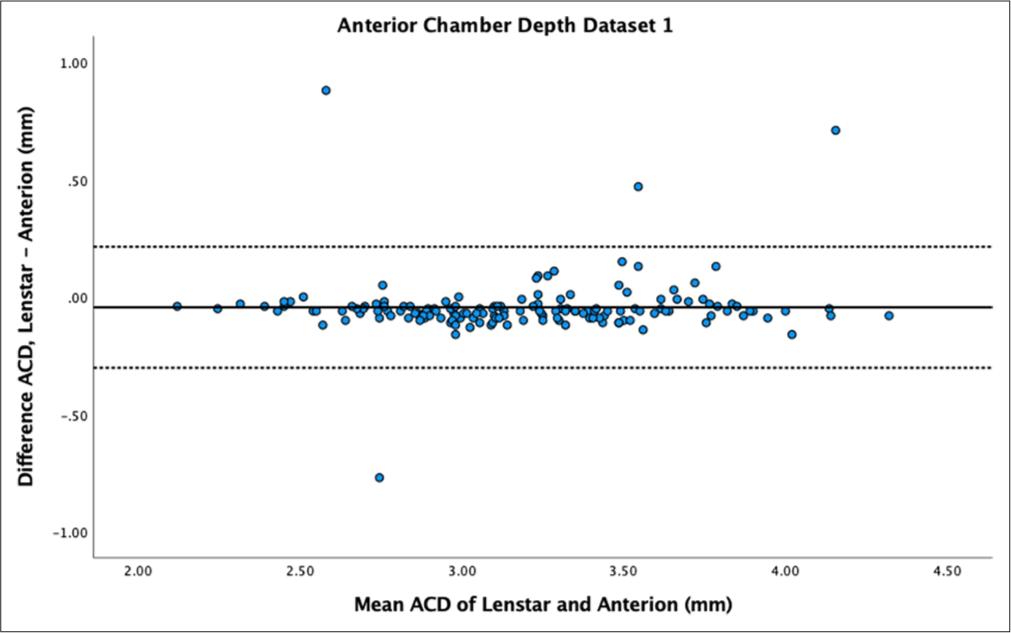
- Bland–Altman plot of anterior chamber depth (ACD) of dataset 1. The mean difference is represented by the solid line and the 95% limits of agreement by the dotted lines.
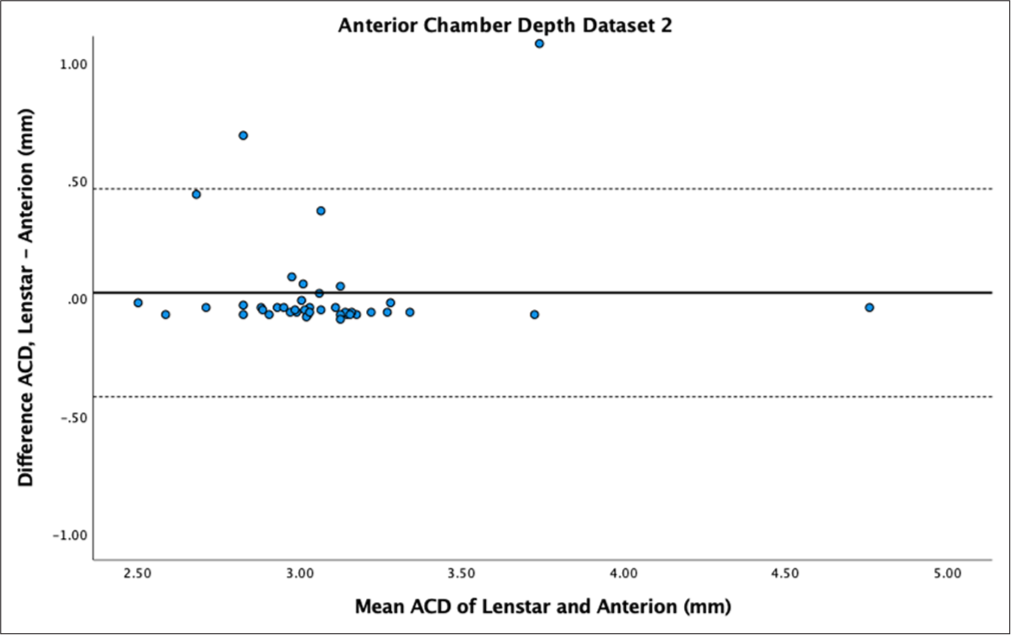
- Bland–Altman plot of anterior chamber depth (ACD) dataset 2. The mean difference is represented by the solid line and the 95% limits of agreement by the dotted lines.
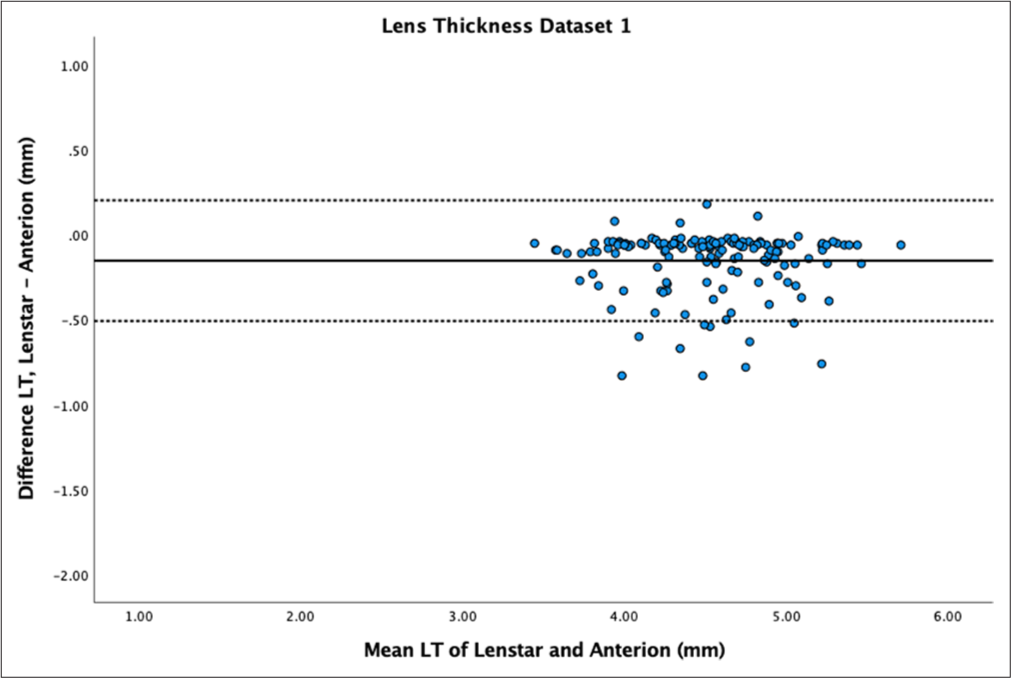
- Bland–Altman plot of lens thickness (LT) of dataset 1. The mean difference is represented by the solid line and the 95% limits of agreement by the dotted lines.
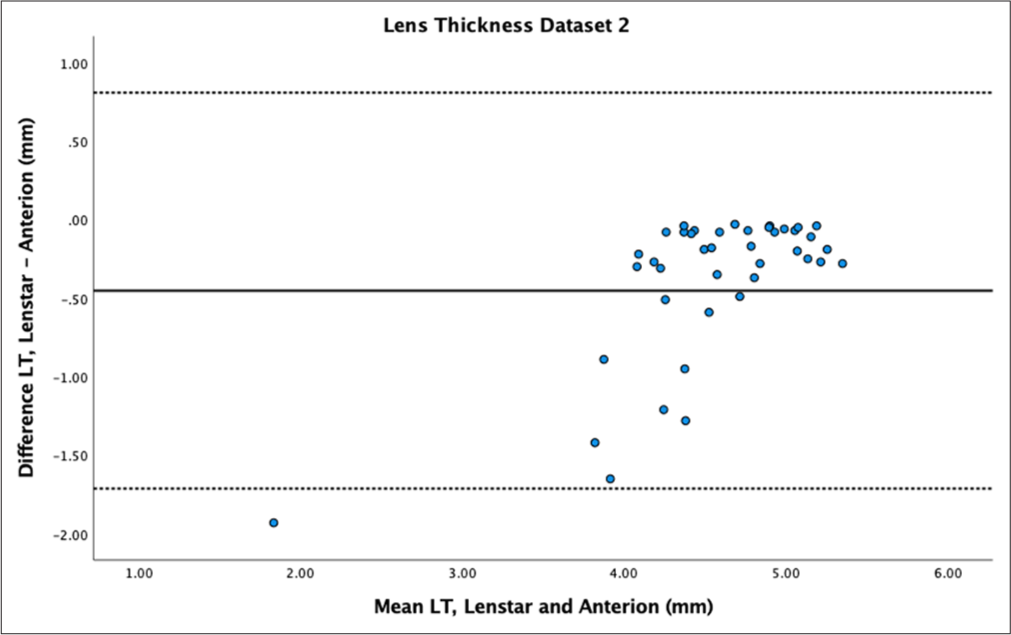
- Bland–Altman plot of lens thickness (LT) of dataset 2. The mean difference is represented by the solid line and the 95% limits of agreement by the dotted lines.
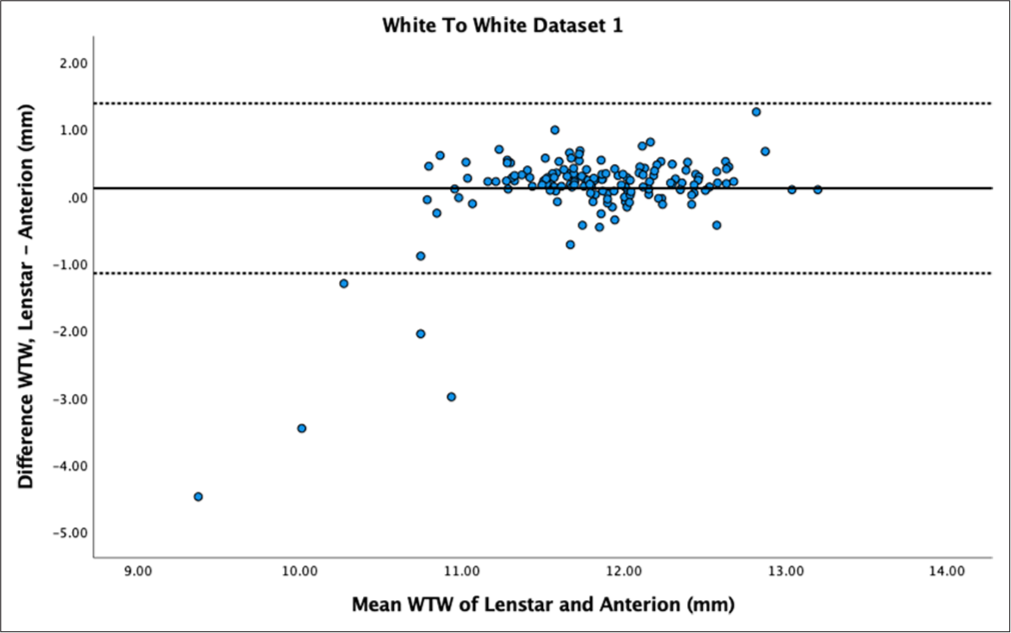
- Bland–Altman plot of white-to-white (WTW) for dataset 1. The mean difference is represented by the solid line and the 95% limits of agreement by the dotted lines.
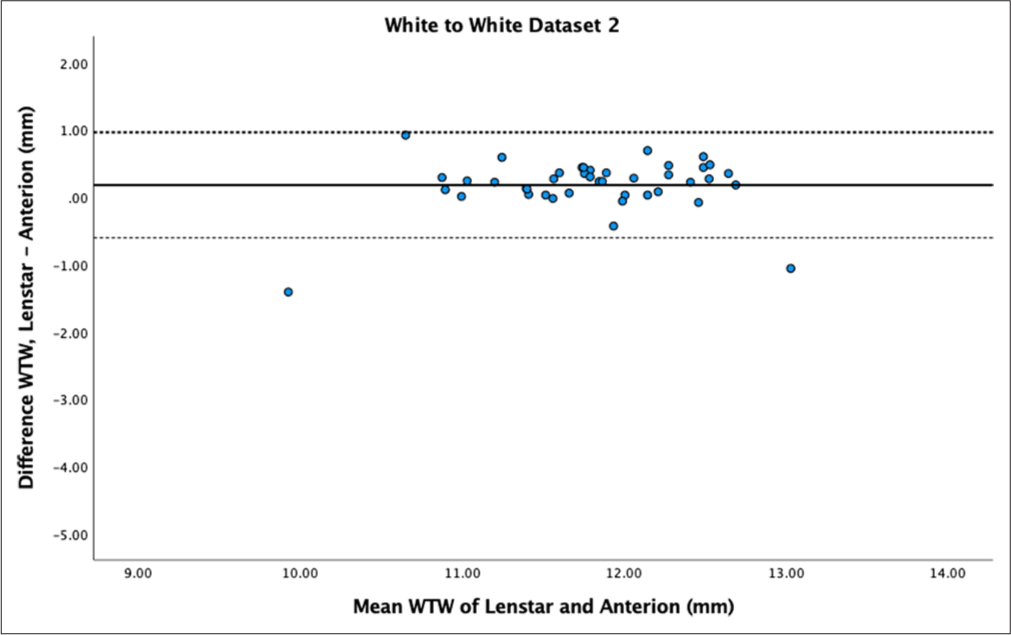
- Bland–Altman plot of white-to-white (WTW) for dataset 2. The mean difference is represented by the solid line and the 95% limits of agreement by the dotted lines.
Axial length (AL)
AL showed no statistically significant difference between biometers for both datasets (P = 0.66 and P = 0.35), with high reproducibility (ICC > 0.9) and mean differences of 0.01 ± 0.13 mm and 0.01 ± 0.07 mm. Bland–Altman plots demonstrated low differences between measurements and narrow LoA [Figures 1 and 2].
Keratometry
While there was no statistically significant difference in K1 for both datasets (P = 0.18 and P = 0.56), Bland–Altman plots showed moderate variability within ± 1 dioptre for both datasets [Figures 3 and 4]. K2 showed statistically significant differences for dataset 1 (P < 0.01) but not for dataset 2 (P = 0.11). Bland–Altman plots for K2 demonstrated greater variability within ± 1 dioptre for both datasets [Figures 5 and 6]. Mean differences between Lenstar and Anterion for K1 and K2 were 0.05 ± 0.49 D and 0.10 ± 0.42 D for dataset 1, and 0.04 ± 0.45 D and 0.10 ± 0.39 D for dataset 2, with high reproducibility in both groups and datasets (ICC > 0.9).
Anterior chamber depth (ACD)
The Bland–Altman plot for ACD showed narrow variability in dataset 1 [Figure 7] but wider variability for dataset 2 [Figure 8]. ACD showed statistically significant differences between samples (P < 0.01) for dataset 1. Dataset 2 did not show statistically significant differences (P = 0.51). ACD mean difference for dataset 1 showed Anterion with greater measurements (−0.04 ± 0.13 mm), contradicting dataset 2 which had Lenstar with greater measurements (0.02 ± 0.26 mm). ACD demonstrated high reproducibility between devices in both datasets (ICC > 0.9).
Lens thickness (LT)
LT showed statistically significant differences between samples (P < 0.01) with mean differences of −0.15 ± 0.18 mm for dataset 1 and −0.45 ± 0.64 mm for dataset 2. LT had high reproducibility between devices for dataset 1 (ICC > 0.9) but poor to moderate reproducibility for dataset 2 (ICC = 0.64). Bland–Altman plots showed a spread of differences for dataset 1 [Figure 9] and very wide LoA with a spread of differences for dataset 2 [Figure 10].
White-to-white (WTW)
The mean difference in WTW measurements between Lenstar and Anterion was 0.12 ± 0.65 mm for dataset 1 and 0.12 ± 0.34 mm for dataset 2, both statistically significant (P = 0.02 and P < 0.01, respectively). Reproducibility was poor to moderate for dataset 1 (ICC = 0.54) and good for dataset 2 (ICC = 0.82). The Bland–Altman plot for dataset 1 [Figure 11] showed similar values for measurements above 11 mm but outliers and larger differences for measurements below 11 mm. Dataset 2 [Figure 12] showed a spread between the LoA.
DISCUSSION
In this study, we evaluated the similarity of biometry measurements between Lenstar and Anterion for AL, flat (K1) and steep (K2) keratometry, ACD, LT and WTW distance in two datasets. The first dataset comprised a larger cohort where biometrics were not necessarily performed on the same day or by the same technician. The second dataset consisted of biometrics conducted on the same day by the same technician.
Our results demonstrated high similarity between the measurements for AL, K1, K2 and ACD in both datasets. The greatest similarity was observed in AL, with an ICC of 0.99 and excellent inter-device agreement of values. Both Lenstar and Anterion have previously shown good repeatability of AL measurement in other studies.[10-12] Our findings align with recent literature.[13]
Keratometry values were flatter in Anterion measurements compared to Lenstar in both datasets for both K1 and K2, but only statistically significant in dataset 1 for K2. These flatter Anterion measurements are consistent with previous publications.[6,14,15] The difference in keratometry values can be attributed to the distinct measurement methods employed by each device. Anterion performs a 65-radial scan at a 3 mm zone, whereas Lenstar takes K readings from 32 points at 1.65 mm and 2.3 mm optical zones. The mean difference in both K1 and K2 in both datasets was small (<0.10 dioptres) and thus not clinically relevant for IOL calculation.
In dataset 1, Anterion measured ACD deeper than Lenstar, and this difference was statistically significant. Our values correlate with other recent studies that have found Anterion to measure deeper ACD compared to Lenstar and other biometers.[6,14,15] Conversely, dataset 2 showed Lenstar with deeper ACD measurements compared to Anterion. However, the presence of outliers in the smaller sample size of dataset 2 may have skewed the mean difference. ACD measurement is crucial, as a change of 0.10 mm accounts for a 0.14 D refractive error change.[16] These findings have implications for short eyes with AL <22 mm, where inclusion of ACD, LT and WTW in the Barrett Universal II lens calculation formula can result in a clinically significant difference in calculated IOL power.[17]
The ICC values differed between the datasets for LT and WTW. LT was found to be greater in Anterion compared to Lenstar in both our datasets. This contradicts other literature that found SS-OCT biometers to have lower values compared to OLCR biometers.[5,18,19] However, it agrees with a study by Vasavada et al., who found higher LT in an SS-OCT biometer compared to an OLCR biometer, although only for dense cataract.[20] Our data included dense cataracts, which could account for the differences, as SS-OCT has demonstrated improved measurements in dense cataracts.[21]
Clinically, LT impacts fourth-generation formulae, which use LT to predict the final IOL position, but it has no significance on predicted IOL power in older formulae.[22] Haigis and Hill-RBF V2.0 have been shown to be significantly influenced by LT, independently of ACD, with a myopic shift with thin lenses and a hyperopic shift with thick lenses.[23] Srivannaboon et al. found that when using the Holladay II formula, measurements from a partial coherence biometer with and without LT values showed a difference of only 0.02D on predicted postoperative spherical equivalent refraction.[17] However, Lam found that using LT rather than age-based LT estimation for the Holladay II formula resulted in a statistically significantly lower mean absolute refractive error, and in 30% of cases, measured LT led to a different IOL choice.[24] A recent study found that excluding LT led to statistically significant differences in absolute prediction error in several formulae.[25]
WTW ICC measurements were also contradictory between the datasets. Other similar studies have shown poor ICC values in WTW compared to other parameters, but not as low as our value in dataset 1.[14] WTW was statistically smaller in Anterion compared to Lenstar, but the Bland–Altman plot for dataset 1 revealed several outlier values where the Lenstar measurements were significantly smaller, with a difference of >2 mm. This discrepancy was particularly noticeable in WTW measurements of <11 mm, where differences between the biometers widened in both datasets. Clinically, this is relevant for implantable Collamer lens and anterior chamber IOL surgery, where sizing is partly based on WTW values. The significant WTW measurement difference could be due to the different measurement techniques employed by the devices. Anterion measures the endpoint of the posterior corneal surface (Schwalbe’s line), whereas Lenstar uses the image of the iris and the eye radii obtained from keratometry.
Our study had several limitations. Only the best scan was taken for analysis rather than an average of scans. Patients with prior corneal surgery, refractive laser treatment, keratoconus or pterygium were excluded from the study. However, patients with dense cataracts were not excluded, nor were other challenging cases such as high myopes, previous ophthalmic surgeries or ocular comorbidities. Hence, a wide range of short and long ALs were included in the study.
CONCLUSION
This study conducted within the NHS, comparing Lenstar and Anterion biometers across two distinct datasets, yields several important findings. First, the consistency of measurements taken on different days by various operators suggests that these biometers are robust to typical clinical variability, a valuable attribute in busy hospital settings where same-day measurements are not always feasible.
Both instruments demonstrated excellent agreement and intradevice consistency for AL, K1 and K2 and ACD. However, statistically significant differences were observed in LT and WTW measurements, irrespective of operator or timing of scans. Notably, WTW measurements below 11 mm showed greater discrepancies between devices, warranting caution in clinical scenarios where precise WTW values are critical, such as in implantable Collamer lens and anterior chamber IOL sizing.
These findings have important clinical implications, particularly for the calculation of IOL power in cataract surgery. The discrepancies in LT measurements may impact newer biometry formulae that incorporate this parameter, potentially affecting IOL power calculations. Furthermore, the variations in ACD, LT and WTW measurements could be particularly significant for short eyes and when using fourth-generation IOL calculation formulae.
While our study demonstrates the overall reliability of these advanced biometers, it also highlights the need for careful interpretation of certain parameters. Clinicians should be aware of these potential discrepancies when using these devices interchangeably or when applying their measurements to various IOL calculation formulae. Future research should focus on the clinical impact of these measurement differences on post-operative refractive outcomes.
In summary, while Lenstar and Anterion provide largely comparable measurements for key biometric parameters, the observed differences in LT and WTW emphasise the importance of consistent device selection in longitudinal patient assessments and careful consideration when applying these measurements to surgical planning.
Ethical approval
The study was registered as an audit at Imperial College NHS Trust and approval sought from the Imperial College Ophthalmology Research Group, February 2023. Audit number OPH_099.
Declaration of patient consent
The authors certify that they have obtained all appropriate patient consent.
Conflicts of interest
There are no conflicts of interest.
Use of artificial intelligence (AI)-assisted technology for manuscript preparation
The authors confirm that there was no use of artificial intelligence (AI)-assisted technology for assisting in the writing or editing of the manuscript and no images were manipulated using AI.
Financial support and sponsorship: Nil.
References
- Sources of error in intraocular lens power calculation. J Cataract Refract Surg. 2008;34:368-76.
- [CrossRef] [PubMed] [Google Scholar]
- Comparison of immersion ultrasound biometry and partial coherence interferometry for intraocular lens calculation according to Haigis. Graefes Arch Clin Exp Ophthalmol. 2000;238:765-73.
- [CrossRef] [PubMed] [Google Scholar]
- Meta-analysis of optical low-coherence reflectometry versus partial coherence interferometry biometry. Sci Rep. 2017;7:43414.
- [CrossRef] [PubMed] [Google Scholar]
- Comparison of a new optical biometer using swept-source optical coherence tomography and a biometer using optical low-coherence reflectometry. J Cataract Refract Surg. 2016;42:1165-72.
- [CrossRef] [PubMed] [Google Scholar]
- Repeatability of 2 swept-source OCT biometers and 1 optical low-coherence reflectometry biometer. J Cataract Refract Surg. 2021;47:1302-7.
- [CrossRef] [PubMed] [Google Scholar]
- Repeatability of whole-cornea measurements using a new swept-source optical coherence tomographer. Eur J Ophthalmol. 2021;31:1709-19.
- [CrossRef] [PubMed] [Google Scholar]
- Enhanced penetration for axial length measurement of eyes with dense cataracts using swept source optical coherence tomography: A consecutive observational study. Ophthalmol Ther. 2018;7:119-24.
- [CrossRef] [PubMed] [Google Scholar]
- Statistical methods for assessing agreement between two methods of clinical measurement. Lancet. 1986;1:307-10.
- [CrossRef] [Google Scholar]
- Ocular biometric repeatability using a new high-resolution swept-source optical coherence tomographer. Expert Rev Med Devices. 2020;17:591-7.
- [CrossRef] [PubMed] [Google Scholar]
- Repeatability of automated measurements by a new anterior segment optical coherence tomographer and biometer and agreement with standard devices. Sci Rep. 2021;11:983.
- [CrossRef] [PubMed] [Google Scholar]
- Comparison of optical low-coherence reflectometry and applanation ultrasound biometry on intraocular lens power calculation. Graefes Arch Clin Exp Ophthalmol. 2011;249:69-75.
- [CrossRef] [PubMed] [Google Scholar]
- Repeatability of a new swept-source optical coherence tomographer and agreement with other three optical biometers. Graefes Arch Clin Exp Ophthalmol. 2022;260:2271-81.
- [CrossRef] [PubMed] [Google Scholar]
- Repeatability of biometry measured by three devices and its impact on predicted intraocular lens power. J Cataract Refract Surg. 2021;47:585-92.
- [CrossRef] [PubMed] [Google Scholar]
- Sources of error in intraocular lens power calculation. J Cataract Refract Surg. 1992;18:125-9.
- [CrossRef] [PubMed] [Google Scholar]
- Biometry with a new swept-source optical coherence tomography biometer: Repeatability and agreement with an optical low-coherence reflectometry device. J Cataract Refract Surg. 2016;42:577-81.
- [CrossRef] [PubMed] [Google Scholar]
- Accuracy of holladay 2 formula using IOLMaster parameters in the absence of lens thickness value. Graefes Arch Clin Exp Ophthalmol. 2013;251:2563-67.
- [CrossRef] [PubMed] [Google Scholar]
- Repeatability and agreement in optical biometry of a new swept-source optical coherence tomography-based biometer versus partial coherence interferometry and optical low-coherence reflectometry. J Cataract Refract Surg. 2016;42:76-83.
- [CrossRef] [PubMed] [Google Scholar]
- High agreement between Barrett Universal II calculations with and without utilization of optional biometry parameters. J Clin Med. 2021;10:542.
- [CrossRef] [PubMed] [Google Scholar]
- Comparison of optical low-coherence reflectometry and swept-source OCT-based biometry devices in dense cataracts. J Refract Surg. 2020;36:557-64.
- [CrossRef] [PubMed] [Google Scholar]
- Clinical comparison of a new swept-source optical coherence tomography-based optical biometer and a time-domain optical coherence tomography-based optical biometer. J Cataract Refract Surg. 2015;41:2224-32.
- [CrossRef] [PubMed] [Google Scholar]
- Optical biometry using partial coherence interferometry In: Intraocular lens power calculations. Thorofare NJ: SLACK Incorporated; 2004. p. :148-9.
- [Google Scholar]
- Anterior chamber depth, lens thickness and intraocular lens calculation formula accuracy: Nine formulas comparison. Br J Ophthalmol. 2022;106:349-55.
- [CrossRef] [PubMed] [Google Scholar]
- Comparison of age-derived lens thickness to optically measured lens thickness in IOL power calculation: A clinical study. J Refract Surg. 2012;28:154-5.
- [CrossRef] [PubMed] [Google Scholar]
- Influence and predictive value of optional parameters in new-generation intraocular lens formulas. J Cataract Refract Surg. 2023;49:795-803.
- [CrossRef] [PubMed] [Google Scholar]


